
See how any ticket actually moves
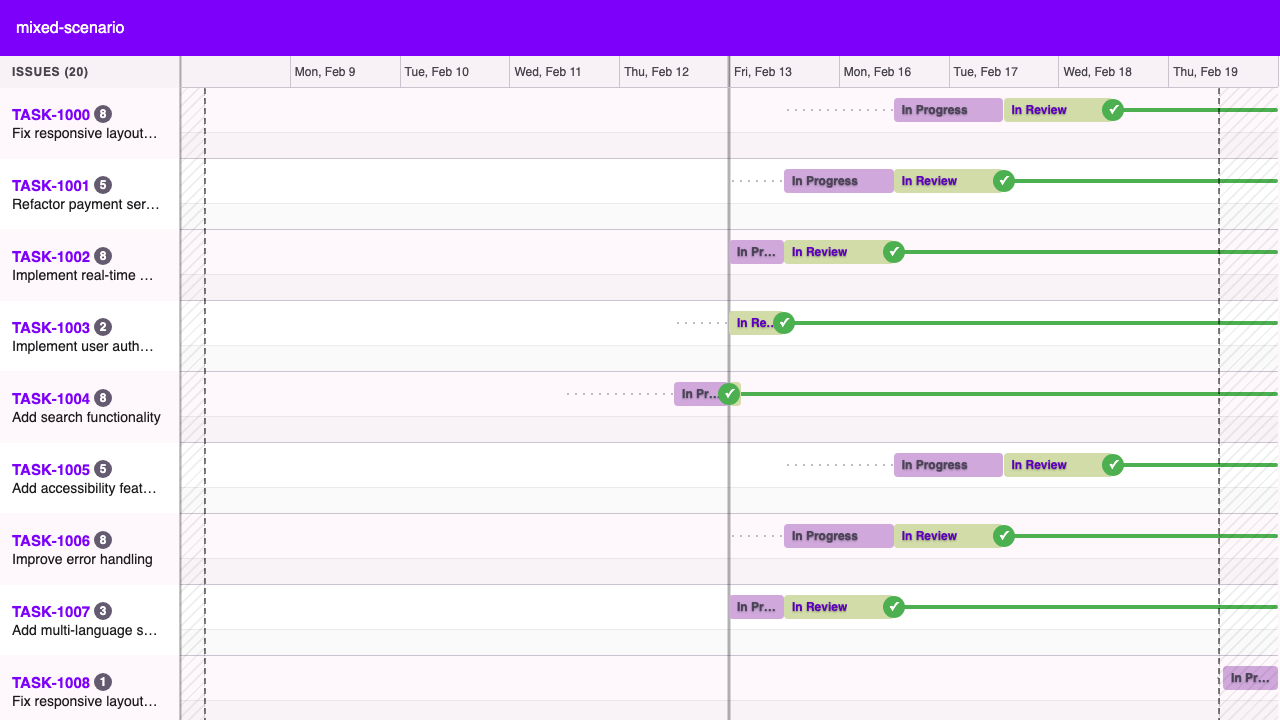
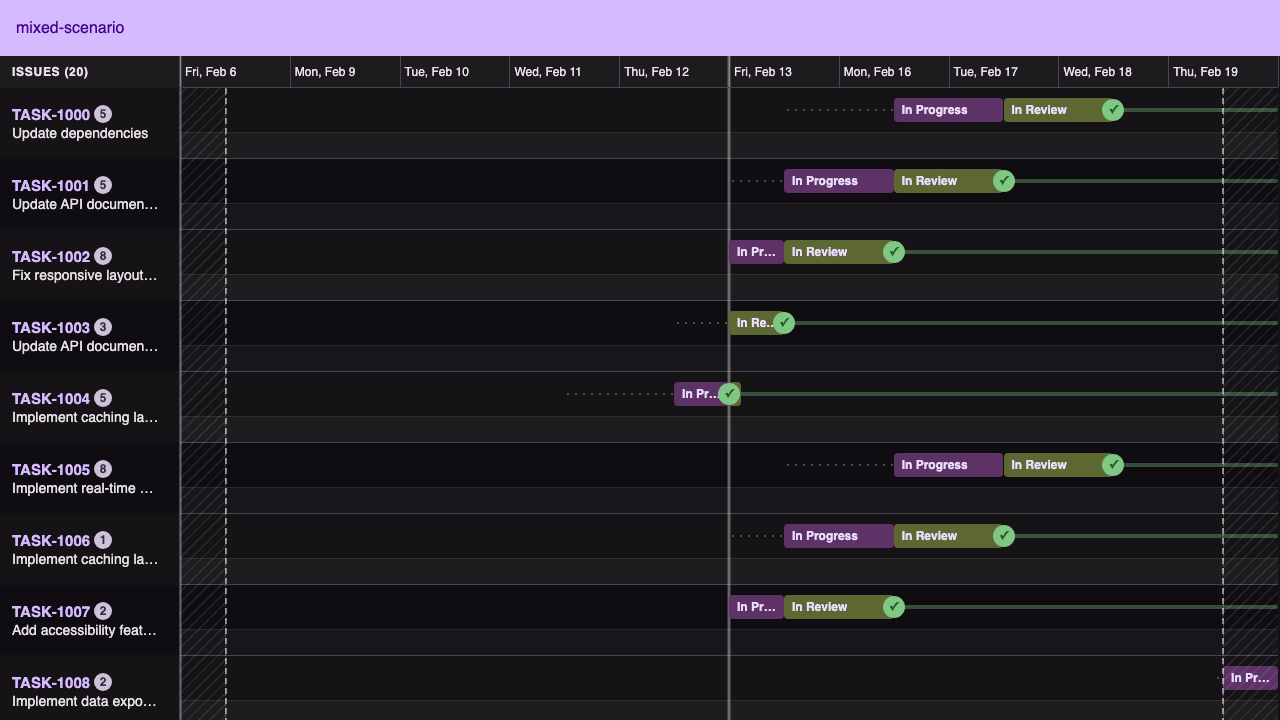
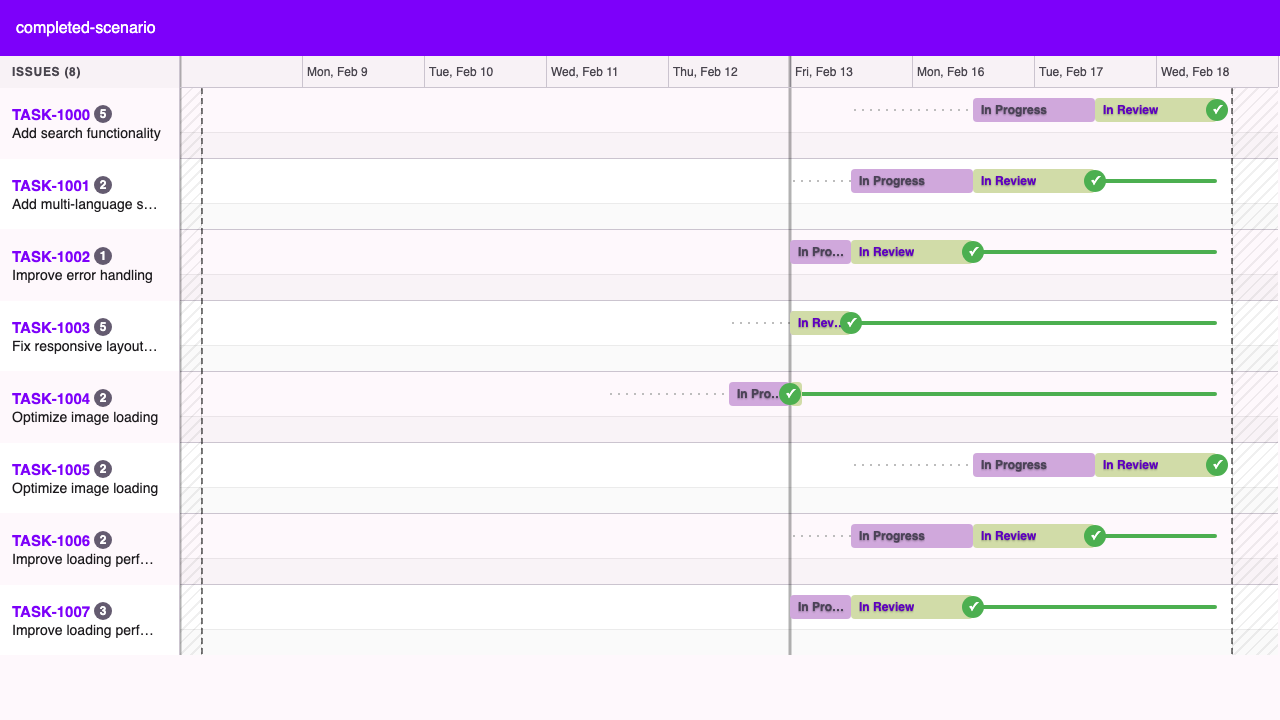
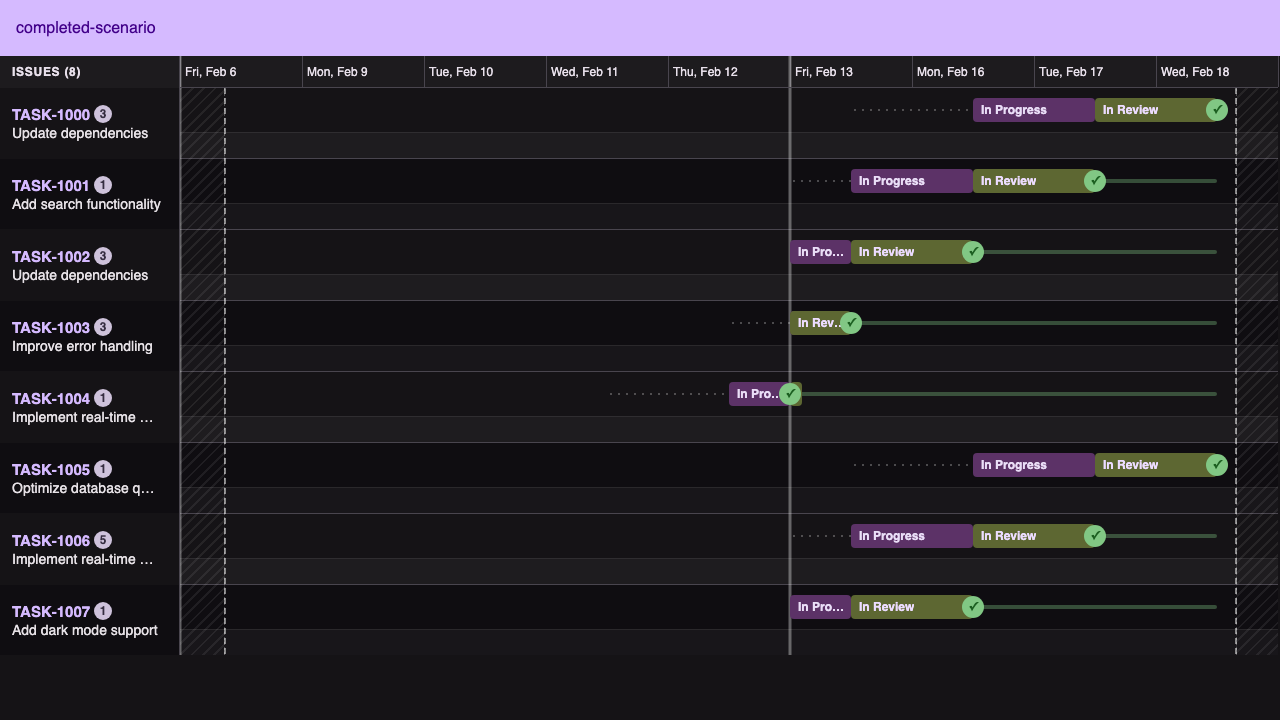
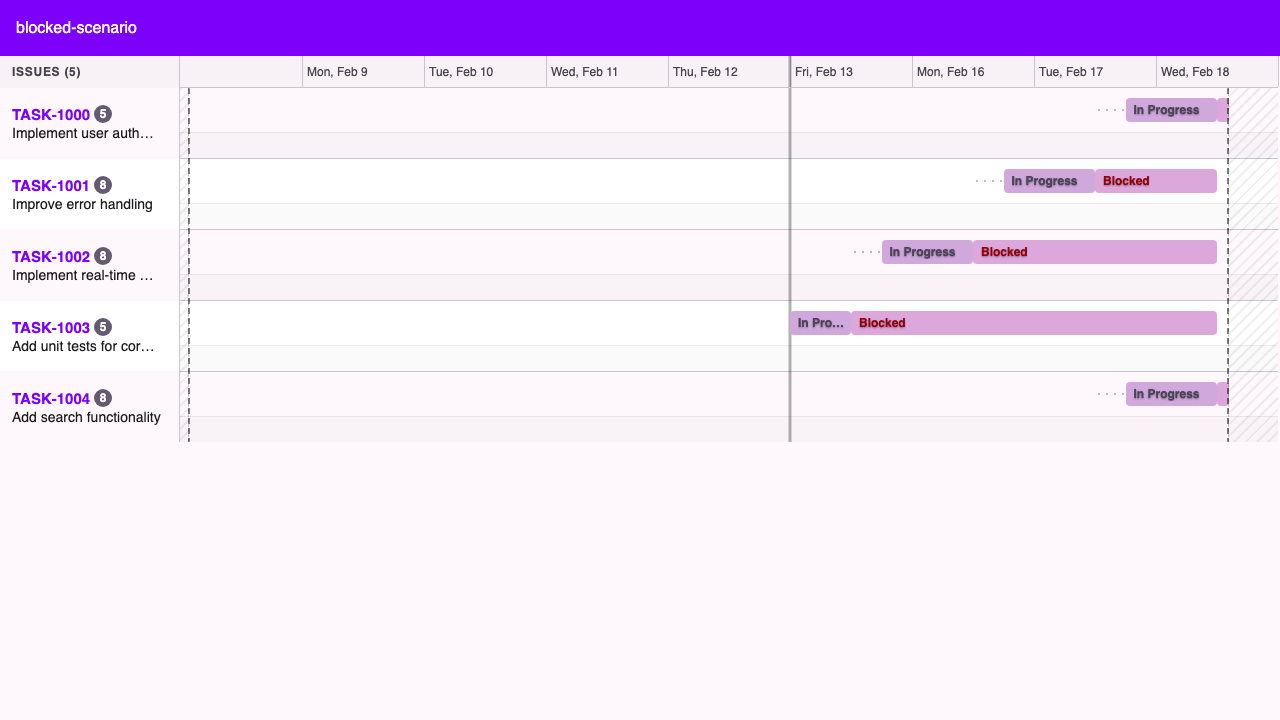
ontracksy draws a timeline of your work — one lane per ticket, one coloured block per state — so you can see what's stalled before you walk into standup.
How it works
One lane per ticket
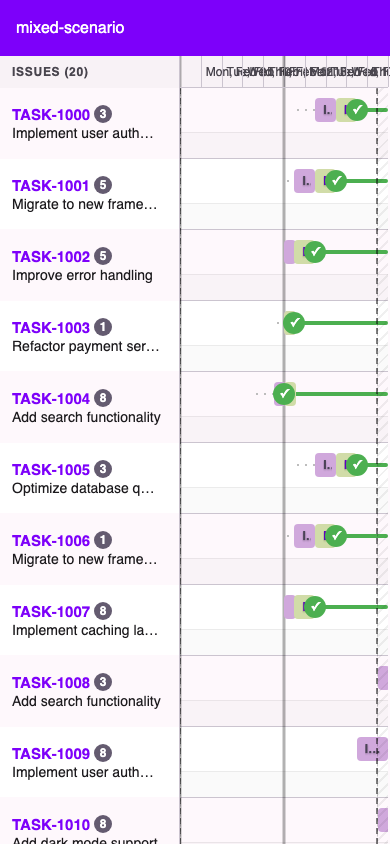
Every item gets its own row; the row is coloured in segments for each state it passed through, so the whole sprint reads at a glance.
Every ticket's state history is fetched or recorded as a plain list of transitions; the timeline renders each one as a lane by walking that list and drawing a coloured segment per state span, entirely on the client.
See what's stuck
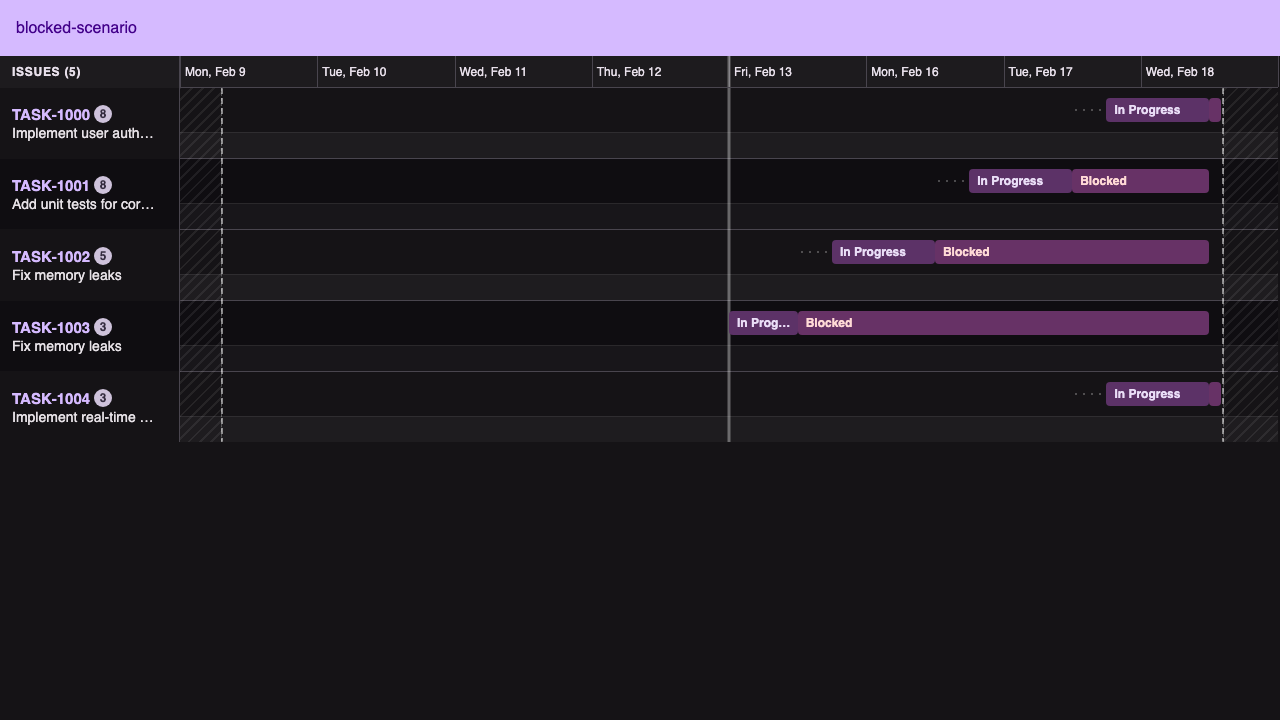
A long block means time spent stuck in one state. Spot it before standup instead of digging through ten tickets.
Segment width is just duration in that state, so outliers are visually obvious without any threshold or alerting logic — the same rendering path works whether the data came from Jira's change log or a manually logged transition.
Local-only means more privacy
No backend, no account — your sprint data never leaves your browser unless you're already sending it to Jira.
Standalone mode persists entirely in the extension's own chrome.storage.local. The Jira-connected mode swaps in a different data adapter behind the same interface — same rendering code, no server of ontracksy's own in either path.
Works with Jira, or without it
Run it standalone with your own manual lanes and states — no login, no setup. Or point the same extension at Jira Cloud and it fills the timeline automatically from your sprint. A Jira Marketplace app, built on the same timeline engine, embeds the same view directly inside Jira.
Chrome and Edge extension · Manifest V3 · works alongside Jira, doesn't replace it